ECG Basics
The electrocardiogram (ECG) is a diagnostic tool that measures and records the electrical activity of the heart in detail. Being able to interpretate these details allows diagnosis of a wide range of heart problems.
ECG Electrodes
Skin Preparation:
Clean with an alcohol wipe if necessary. If the patients are very hairy – shave the electrode areas.
ECG standard leads
There are three of these leads, I, II and III.
Lead I: is between the right arm and left arm electrodes, the left arm being positive.
Lead II: is between the right arm and left leg electrodes, the left leg being positive.
Lead III: is between the left arm and left leg electrodes, the left leg again being positive.
Chest Electrode Placement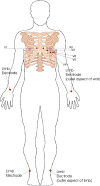
V1: Fourth intercostal space to the right of the sternum.
V2: Fourth intercostal space to the Left of the sternum.
V3: Directly between leads V2 and V4.
V4: Fifth intercostal space at midclavicular line.
V5: Level with V4 at left anterior axillary line.
V6: Level with V5 at left midaxillary line. (Directly under the
midpoint of the armpit)
Click on Picture to view large image
ECG Leads - Views of the Heart
|
Chest Leads V1 & V2 V3 & V4 V5 & V6 |
View Right Ventricle Septum/Lateral Left Ventricle Anterior/Lateral Left Ventricle |
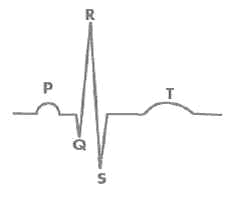
The ECG records the electrical activity that results when the heart muscle cells in the atria and ventricles contract.
- Atrial contractions show up as the P wave.
- Ventricular contractions show as a series known as the QRS complex.
- The third and last common wave in an ECG is the T wave. This is the electrical activity produced when the ventricles are recharging for the next contraction (repolarizing).
- Interestingly, the letters P, Q, R, S, and T are not abbreviations for any actual words but were chosen many years ago for their position in the middle of the alphabet.
- The electrical activity results in P, QRS, and T waves that are of different sizes and shapes. When viewed from different leads, these waves can show a wide range of abnormalities of both the electrical conduction system and the muscle tissue of the hearts 4 pumping chambers.
ECG Interpretation
The graph paper that the ECG records on is standardised to run at 25mm/second, and is marked at 1 second intervals on the top and bottom. The horizontal axis correlates the length of each electrical event with its duration in time. Each small block (defined by lighter lines) on the horizontal axis represents 0.04 seconds. Five small blocks (shown by heavy lines) is a large block, and represents 0.20 seconds.

Duration of a waveform, segment, or interval is determined by counting the blocks from the beginning to the end of the wave, segment, or interval.
P-Wave: represents atrial depolarization - the time necessary for an electrical impulse from the sinoatrial (SA) node to spread throughout the atrial musculature.
- Location: Precedes QRS complex
Amplitude: Should not exceed 2 to 2.5 mm in height Duration: 0.06 to 0.11 seconds
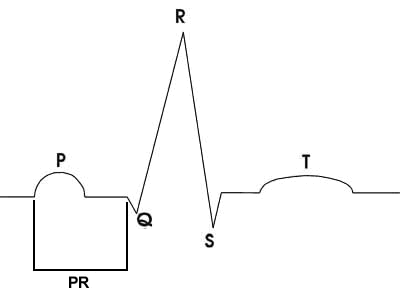
P-R Interval: represents the time it takes an impulse to travel from the atria through the AV node, bundle of His, and bundle branches to the Purkinje fibres.
- Location: Extends from the beginning of the P wave to the
beginning of the QRS complex
Duration: 0.12 to 0.20 seconds.
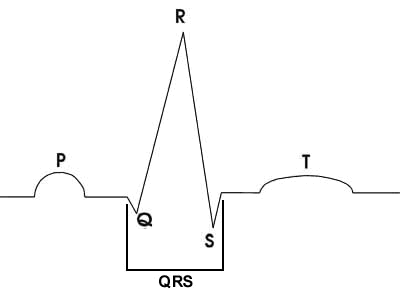
QRS Complex: represents ventricular depolarisation. The QRS complex consists of 3 waves: the Q wave, the R wave, and the S wave.
-
The Q wave is always located at the beginning of the QRS complex.
It may or may not always be present.
The R wave is always the first positive deflection.
The S wave, the negative deflection, follows the R wave -
Location: Follows the P-R interval
Amplitude: Normal values vary with age and sex
Duration: No longer than 0.10 seconds
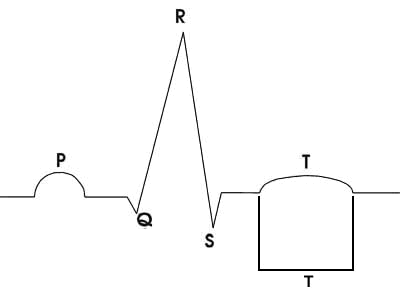
Q-T Interval: represents the time necessary for ventricular depolarization and repolarization.
-
Location: Extends from the beginning of the QRS complex to the end of the T wave
(includes the QRS complex, S-T segment, and the T wave)
Duration: Varies according to age, sex, and heart rate
T Wave: represents the repolarization of the ventricles. On rare occasions, a U wave can be seen following the T wave. The U wave reflects the repolarization of the His-Purkinje fibres.
-
Location: Follows the S wave and the S-T segment
Amplitude: 5mm or less in standard leads I, II, and III; 10mm or less in precordial leads V1-V6.
Duration: Not usually measured
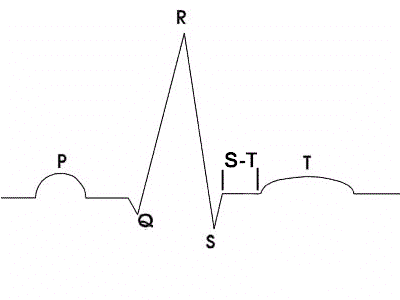
S-T Segment: represents the end of the ventricular depolarization and the beginning of ventricular repolarization.
-
Location: Extends from the end of the S wave to the beginning of the T wave
Duration: Not usually measured
The ECG and Myocardial Infarction
During an MI, the ECG goes through a series of abnormalities. The initial abnormality is called a hyperacute T wave. This is a T wave that is taller and more pointed than the normal T wave.
Hyperacute T Wave
The abnormality lasts for a very short time, and then elevation of the ST segment occurs. This is the hallmark abnormality of an acute MI. It occurs when the heart muscle is being injured by a lack of blood flow and oxygen and is also called a current of injury.

ST Elevation
An ECG can not only tell you if an MI is present but can also show the approximate location of the heart attack, and often which artery is involved. When the ECG abnormalities mentioned above occur, then the MI can be localized to a certain region of the heart. For example, see the table below:
| ECG leads | Location of MI | Coronary Artery |
| II, III, aVF | Inferior MI | Right Coronary Artery |
| V1-V4 | Anterior or Anteroseptal MI | Left Anterior Descending Artery |
| V5-V6, I,aVL | Lateral MI | Left Circumflex Artery |
| ST depression in V1, V2 | Posterior MI | Left Circumflex Artery or Right Coronary Artery |
Further Reading
-
ecgskills.net - An online training resource for all healthcare practitioners involved in conducting and interpreting Electrocardiographs (ECG)